Effective Compute #
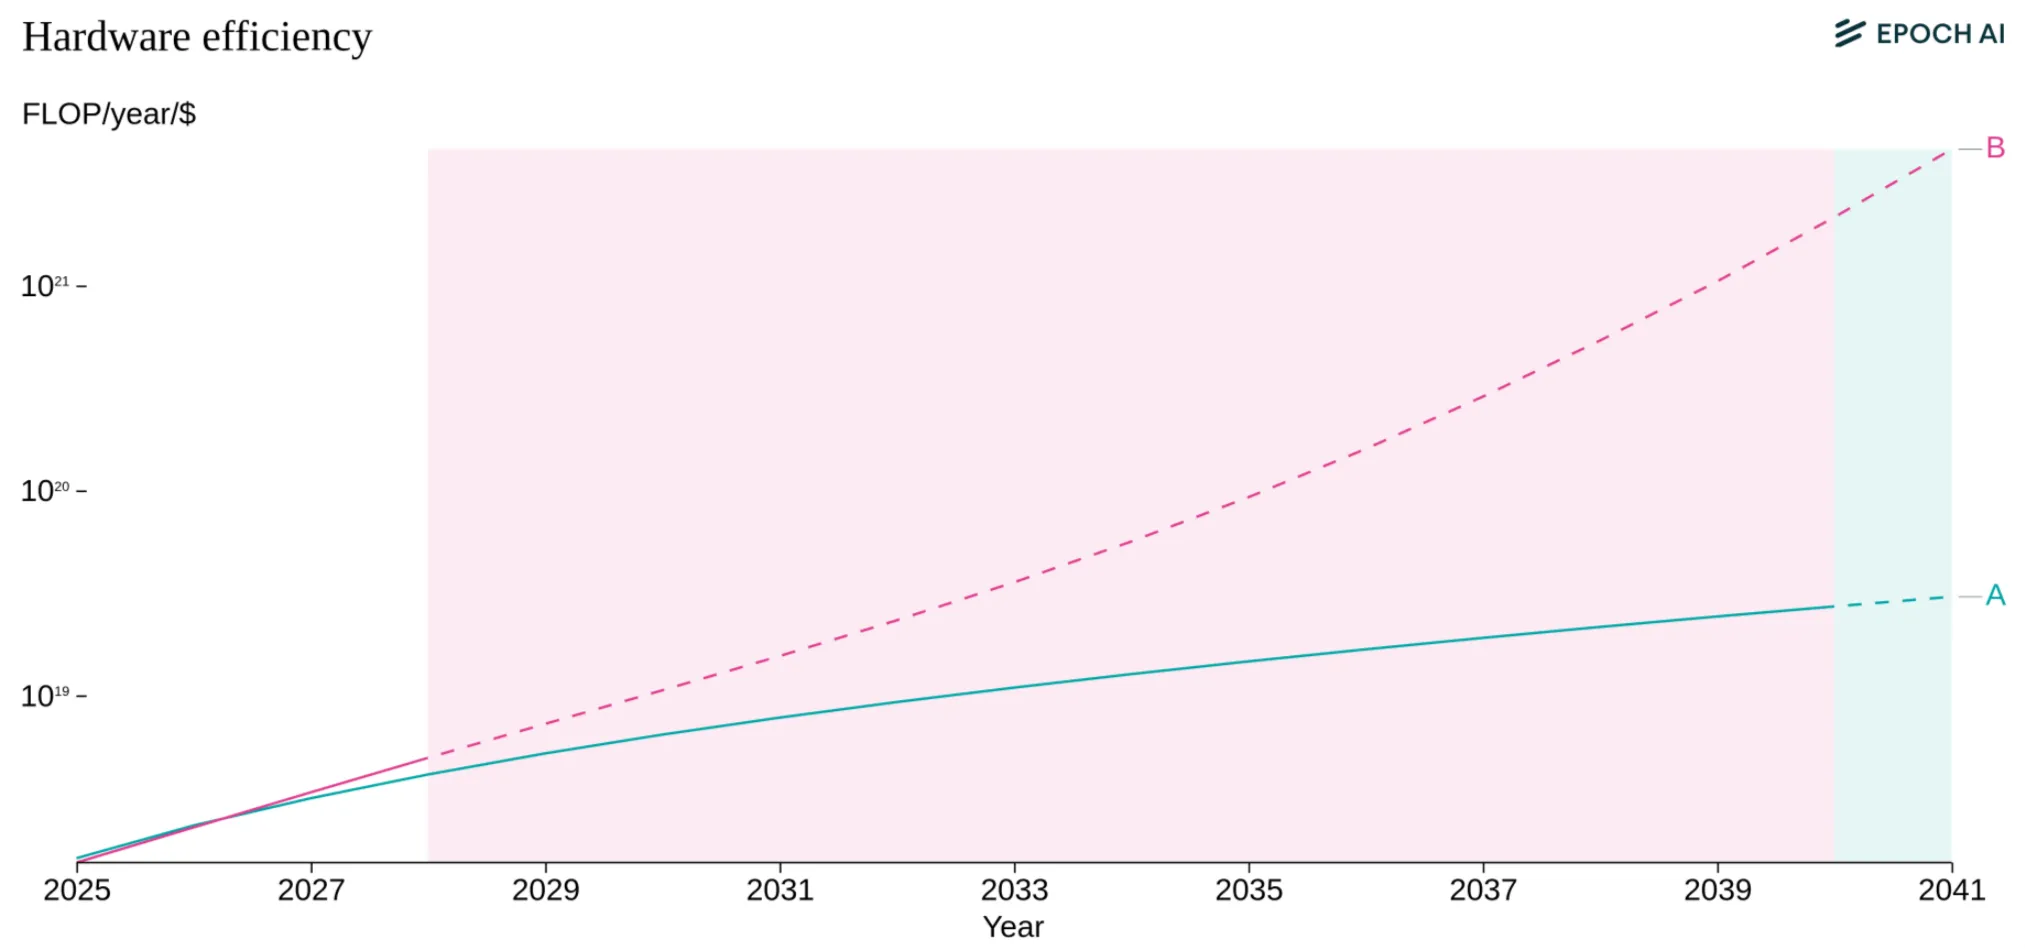
Hardware Efficiency #
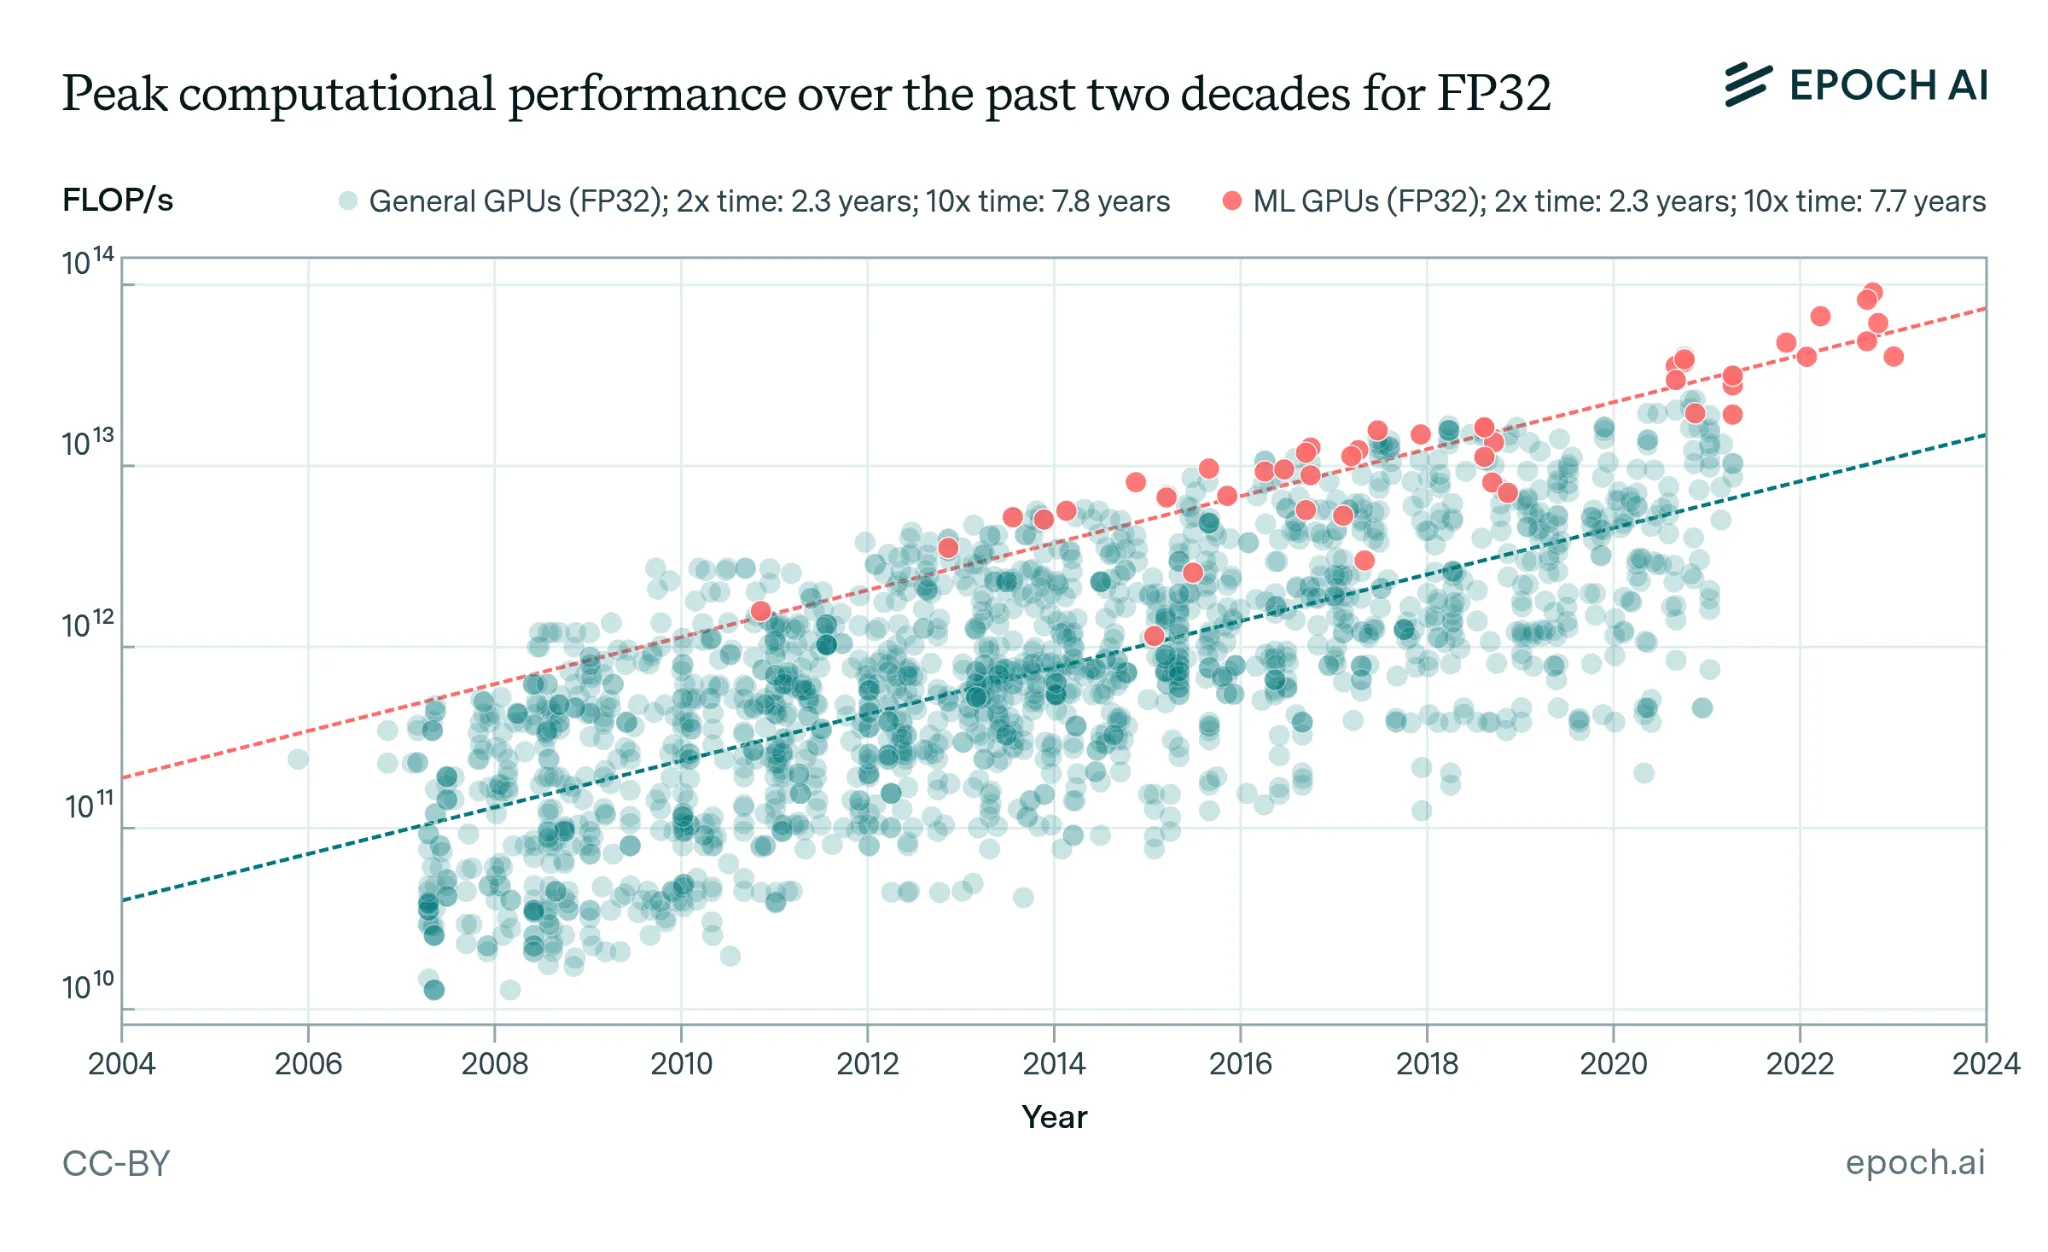
The first factor in increasing effective compute is - how efficient is the hardware that we produce at doing computation?
AI chips are getting about 35% more powerful each year, but we're approaching physical limits. Since around 2010, the raw computational performance (FLOP/s) of GPUs in FP32 precision has grown by roughly 1.35× per year (Epoch AI, 2023; Hobbahn et al., 2023). The improvement comes from things like denser transistors, specialized AI circuitry, and switching to lower-precision number formats. Performance per dollar has improved rapidly, and hardware at any given precision and fixed performance level becomes 30% cheaper each year. At the same time, manufacturers continue to introduce more powerful and expensive hardware (Epoch AI, 2025)
In the near future this trend seems likely to continue, but thermodynamic limits will eventually stop this trend. Chips can only get so energy-efficient before physics says “no”. Every computation generates heat as a fundamental law of physics, not an engineering problem. Current analysis suggests there is room for a 50 to 1,000× improvement in energy efficiency before we hit fundamental CMOS limits, with a 50% chance that improvements cease before a roughly 200× improvement on existing technology. These estimates suggest that CMOS processors are likely sufficiently efficient to power substantially larger AI training runs than today. 7 This implies we have significant headroom to scale using current silicon paradigms through 2030 and beyond, although hardware R&D returns may eventually diminish as we approach physical limits. Beyond these limits, training runs would likely require radical changes to computing paradigms, like a shift to adiabatic computing (Ho et al., 2023; Sevilla et al., 2024).
Software and Algorithmic Efficiency #
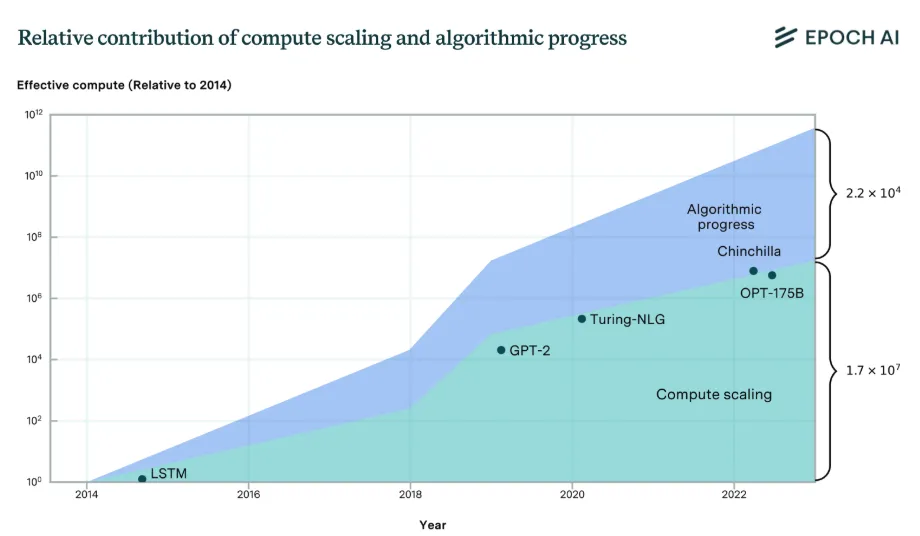
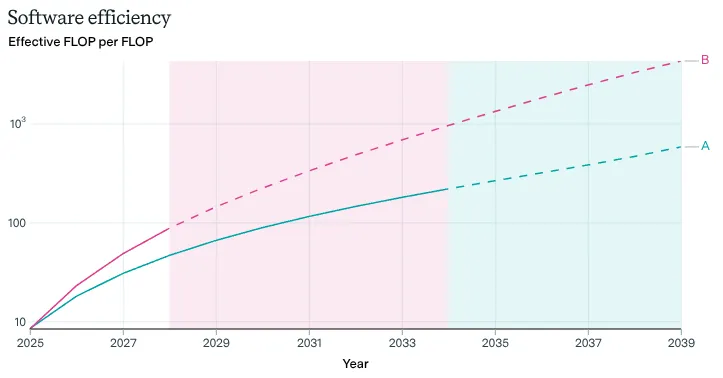
The second factor in increasing effective compute is - how well we can utilize all the existing hardware that we have. This is separate from just making the physical hardware itself more efficient.
Better algorithms have cut the compute needed for a given result by ~3× per year. The level of compute needed to achieve a given level of performance has halved roughly every 8 months 8 . This rapid improvement means that the compute required to achieve specific levels of capability on benchmarks can drop by orders of magnitude over just a few years of algorithmic progress. The improvements to compute efficiency explain roughly 35% of performance improvements in language modeling since 2014, with the other 65% coming from just building more chips and running them longer. Overall, this means we're getting smarter about using available hardware, and not just throwing more compute at problems (Epoch AI, 2023; Ho et al., 2024).
Semiconductor Production #
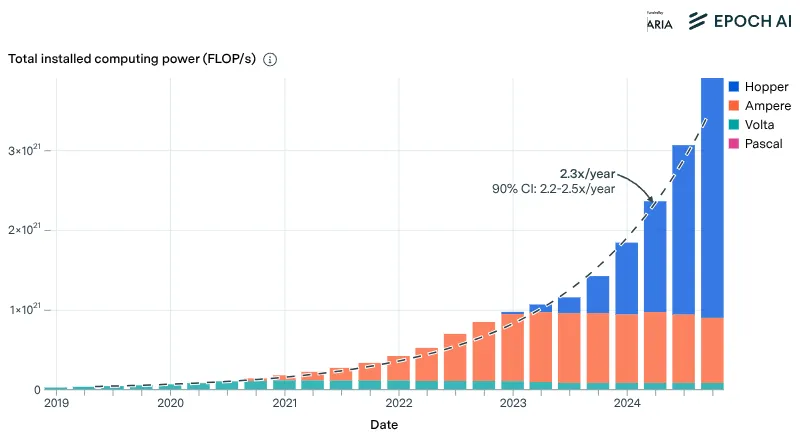
The third factor in increasing effective compute is - how many chips can you actually build?
Total available computing power from NVIDIA chips has grown by approximately 2.3x per year since 2019, enabling the training of ever-larger models. NVIDIA designs a dominant share of AI training chips, and Taiwan's TSMC serves as the primary chip fab for these manufacturers. The AI chip supply chain is highly concentrated. In 2024 TSMC dedicated roughly 5% of their advanced chip production to AI accelerators—the rest goes to phones, computers, and other electronics (Sevilla et al., 2024). If AI labs want dramatically more chips, TSMC would need to shift priorities, expand capacity, and compete with other customers who also want cutting-edge semiconductors (Epoch AI, 2025).
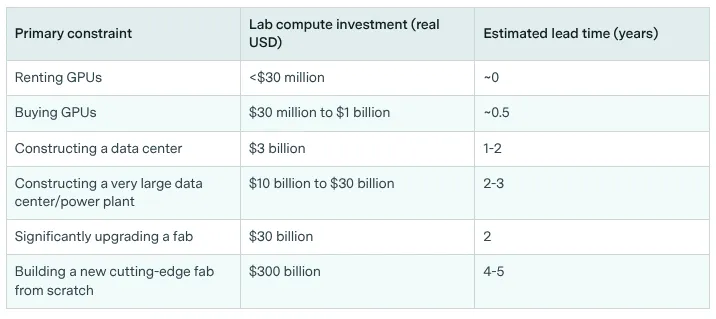
Investment doesn't immediately make chip production go faster. If some country wants to build their own TSMC equivalent, then it can take 4-5 years to build a new cutting-edge fab (accounting for construction and permitting), though upgrading an existing fab takes less time, around 2 years in addition to billions in investment (Edelman & Ho, 2025; Epoch AI, 2025). Besides the existing competition for chips from TSMC, another factor is that the machines TSMC needs to manufacture the chips. These are almost exclusively made by a single company: ASML in the Netherlands (Blablová, 2025). These extreme ultraviolet (EUV) lithography machines cost between $150 million to $380 million each. If/When someone (e.g. TSMC) wants to expand production, they can't just order fifty more next month. They join an already long waitlist (Edelman & Ho, 2025; Sevilla, AXRP Podcast, 2024).
Investment and Training Costs #
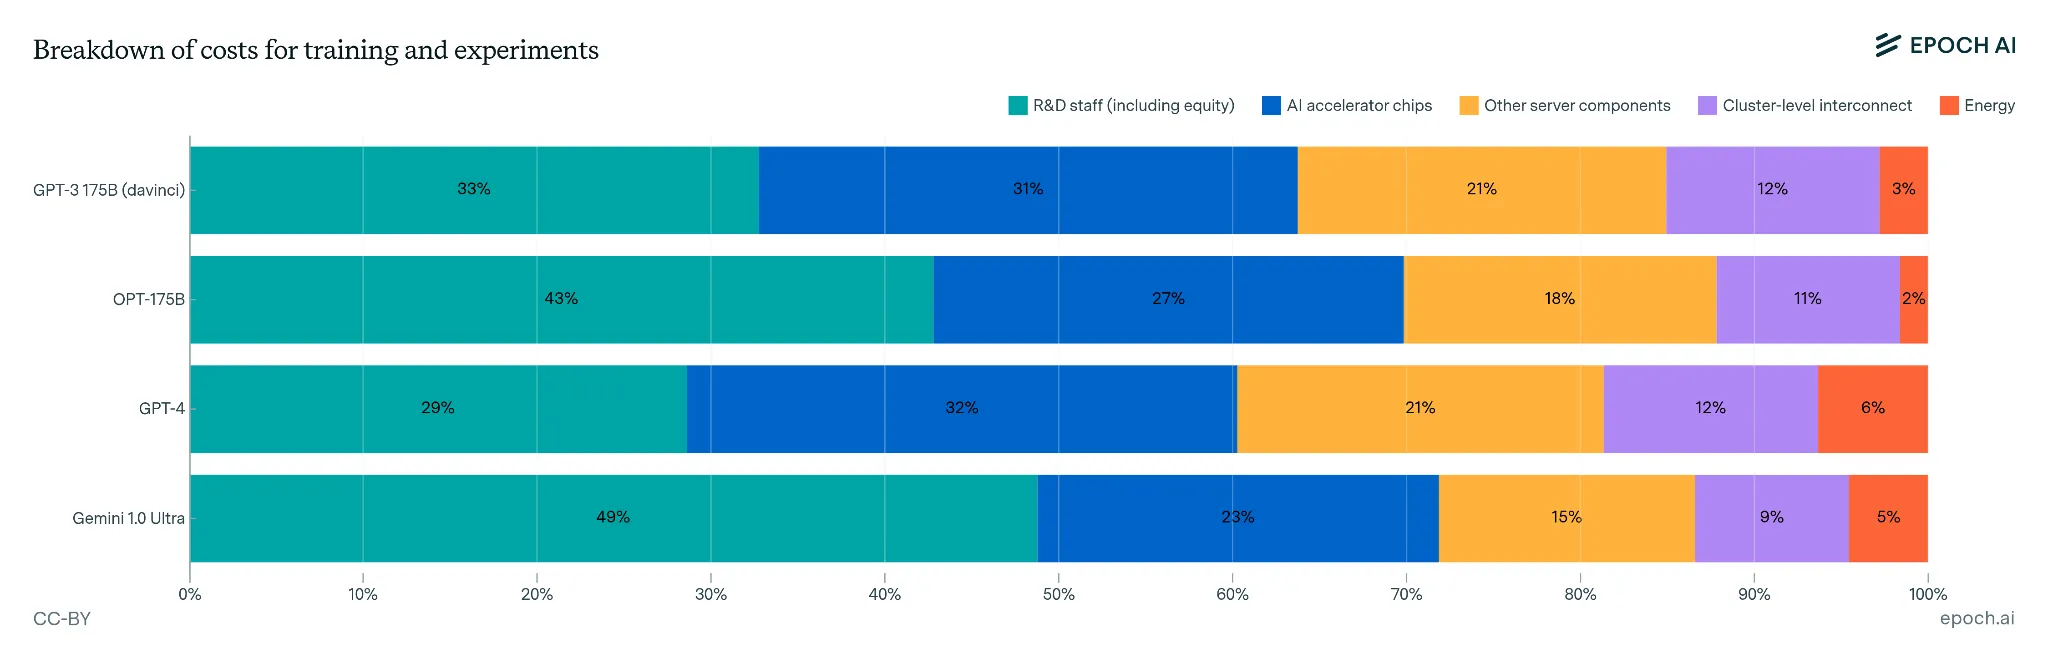
The cost in USD of training frontier models has grown by 3.5x per year per year since 2020. If trends continue, we'll see the training cost for a single model approach billion-dollar training runs by 2027. The cost breaks down roughly as: 50-65% for hardware (spread across its useful life), 30-45% for the researchers and engineers, and 2-6% for electricity. This is venture capital and Big Tech money so far, but these numbers are approaching scales where only nations or the largest corporations can compete (Cottier et al., 2025).
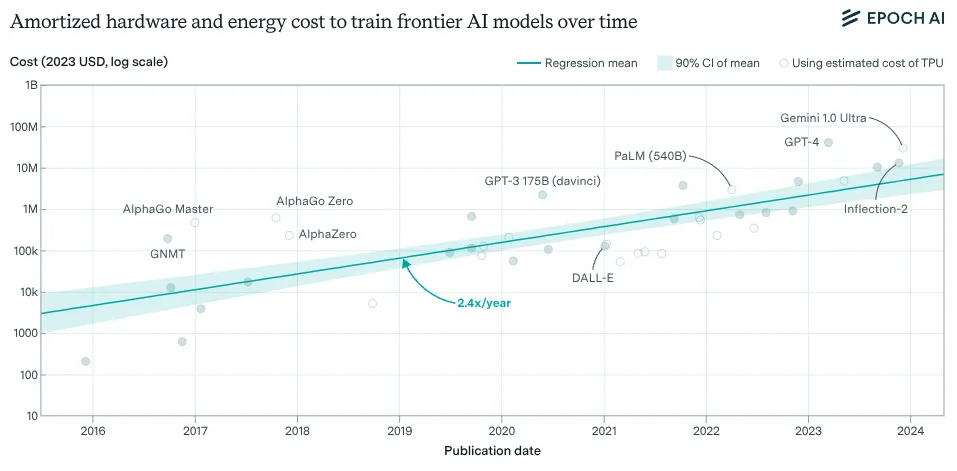
The acquisition cost in USD of the hardware used to train frontier AI models has grown by 2.5x per year since 2016. To give you a sense of how much training a frontier model costs, the total amortized cost of developing Grok-4 (released in July 2025), including hardware and electricity, is estimated at $480 million USD. The acquisition cost of the hardware to train Grok-3, including GPUs, other server components, and networking, is estimated at $3 billion USD. The hardware used to train Grok 4 may have been even more expensive (Epoch AI, 2025).
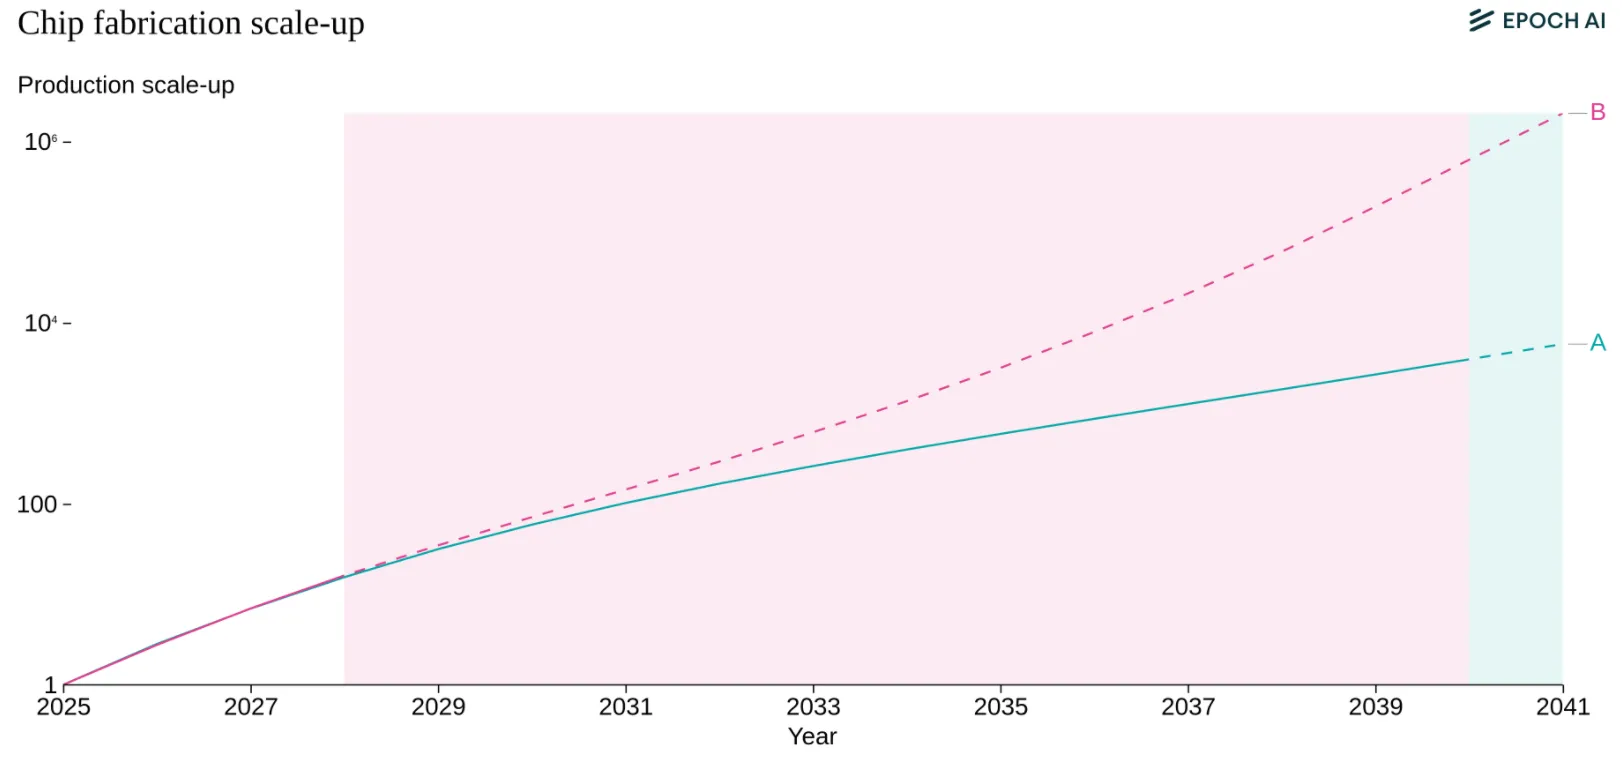
An unknown question is whether the returns to productivity gains will justify continued investment. 2025 saw a lot of news headlines about circular investment and an “AI bubble”. If AI can automate significant portions of cognitive work, capturing even a fraction of the global labor market makes trillion-dollar investments rational. However, massive investments face increasing hurdles due to structural constraints. As compute scales up, the lead time between project initiation and deployment lengthens significantly—roughly one year for every ten-fold increase in scale—creating a feedback loop that naturally slows the pace of scaling (Edelman & Ho, 2025). This uncertainty regarding long-term returns over extended periods may drive investors to prefer incremental scaling, breaking up projects into smaller chunks to gauge returns before committing further, rather than making massive upfront investments (Edelman & Ho, 2025). Several things could break the pattern entirely: models hitting a capability ceiling where more compute doesn't help, regulations capping training runs or data center sizes, energy costs making large runs uneconomical, or economic recession drying up capital. Each represents a distinct way scaling could stop independent of technical feasibility.
Power Consumption #
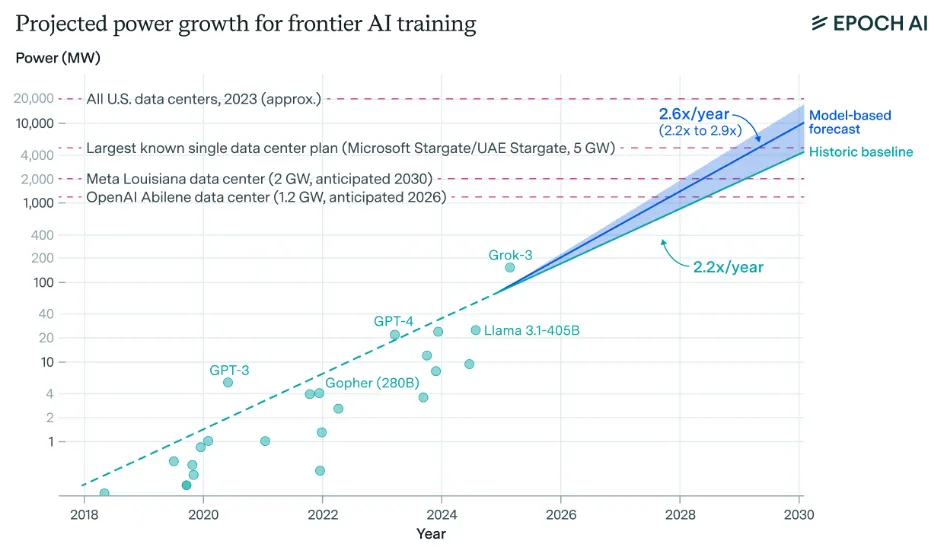
Training frontier models requires enough electrical power to run a small city. GPT-4's training run likely consumed around 50 megawatts, equivalent to powering roughly 40,000 US homes. If compute scaling continues at 4-5× per year, frontier training runs will require 4-16 gigawatts by 2030—matching the Grand Coulee Dam, America's largest power plant (You et al., 2025).
Energy costs remain small relative to hardware costs but this could change. Currently, electricity costs represent only 2-6% of total training costs, with hardware and labor dominating the budget (Cottier et al., 2024). But if training runs scale to 10+ gigawatts while hardware efficiency improvements slow down, energy could become a much larger fraction of costs. At $0.05 per kilowatt-hour, a 10 GW training run running for 100 days costs roughly $120 million just for electricity. That's still less than the hardware, but it's no longer negligible. And in practice, securing multi-gigawatt power supplies might cost significantly more than wholesale electricity rates suggest.
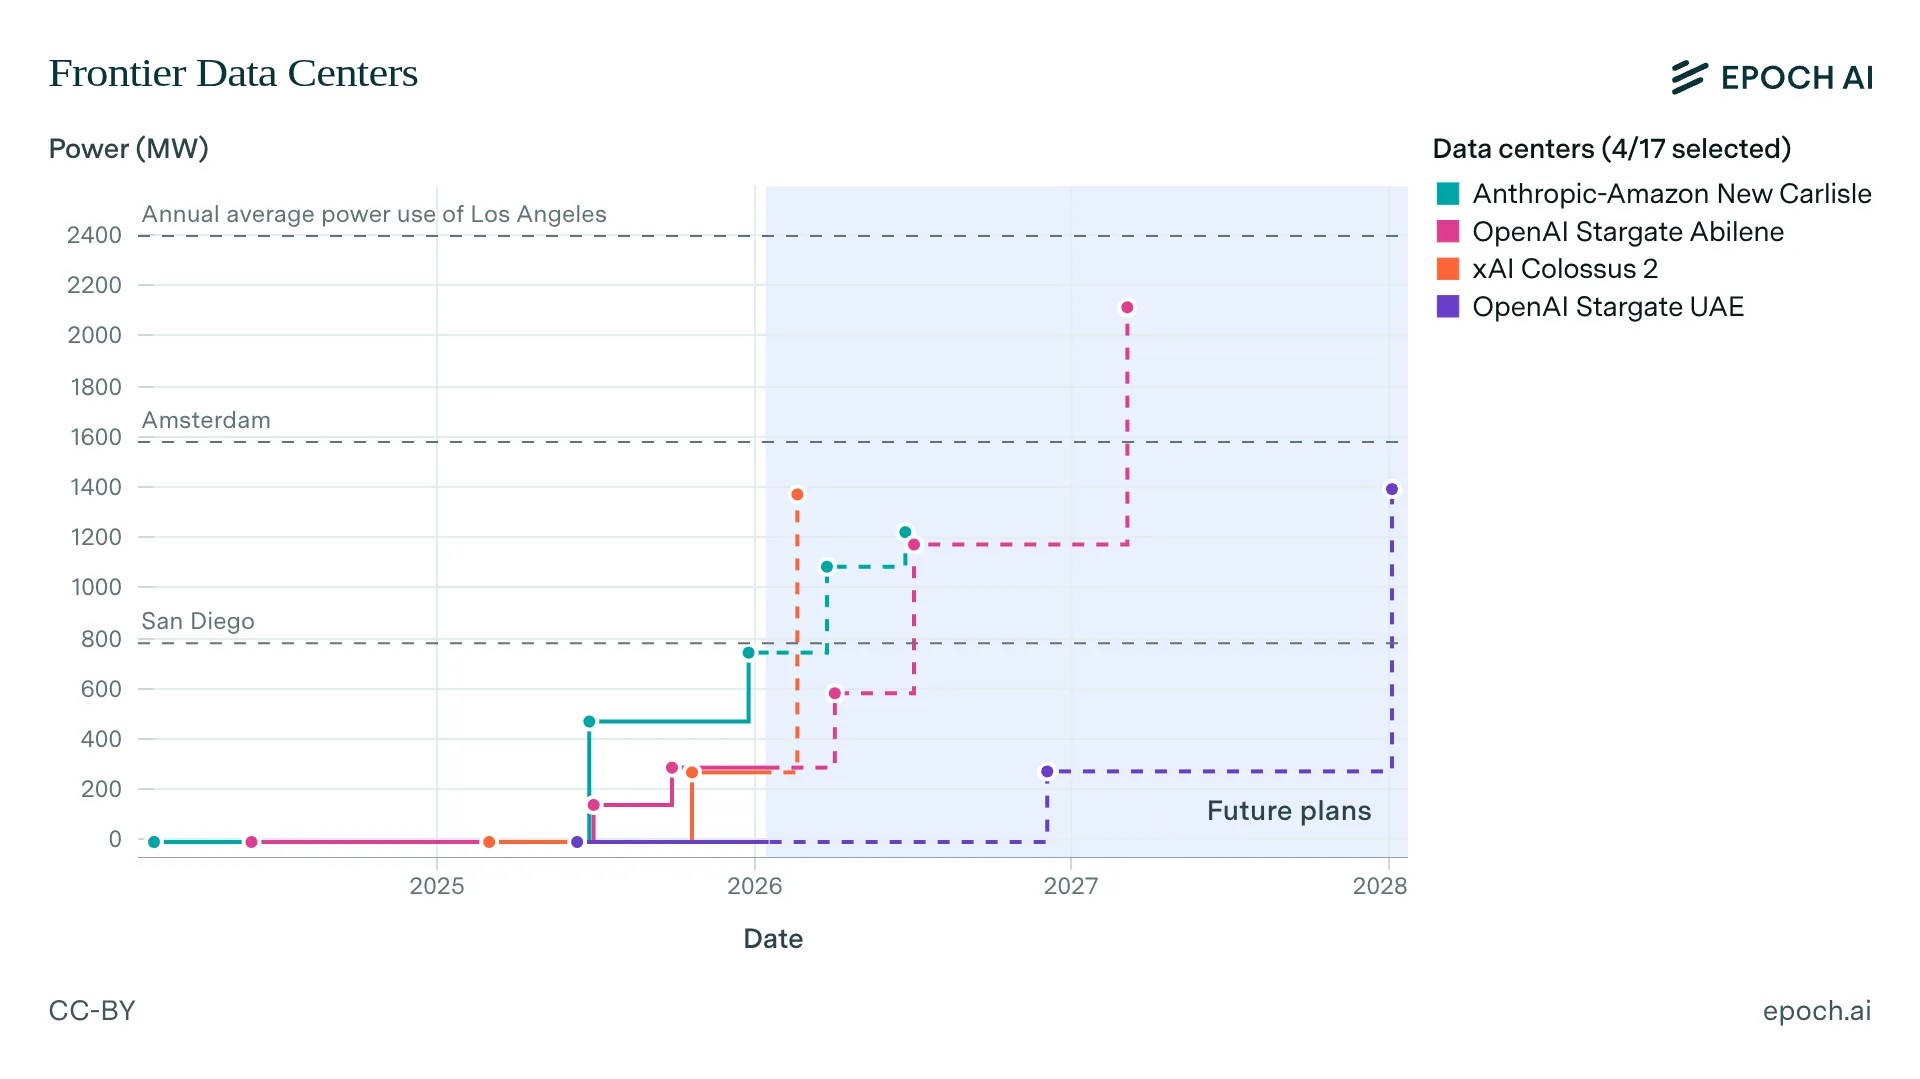
Scaling AI systems to the forecasted levels of 2030 will require substantial power infrastructure. A training run of FLOP would require approximately 6 GW of power, assuming improvements in hardware efficiency. This scale necessitates data center campuses ranging from 1 to 5 GW by the end of the decade (Sevilla et al., 2024). Lead times increase with scale: every additional 10× increase in compute stock adds roughly one year to project timelines. Constructing the necessary large-scale power plants typically takes 2-3 years (Edelman & Ho, 2025). Despite these hurdles, the cost of power remains a small fraction of data center expenses—roughly one-tenth the cost of the chips - making the capital investment rational given the potential returns (Ho et al., 2025).
Footnotes
Was this section useful?
Thank you for your feedback
Your input helps improve the Atlas.